changelog/cohort-revenue-explorershipped may 15, 2026
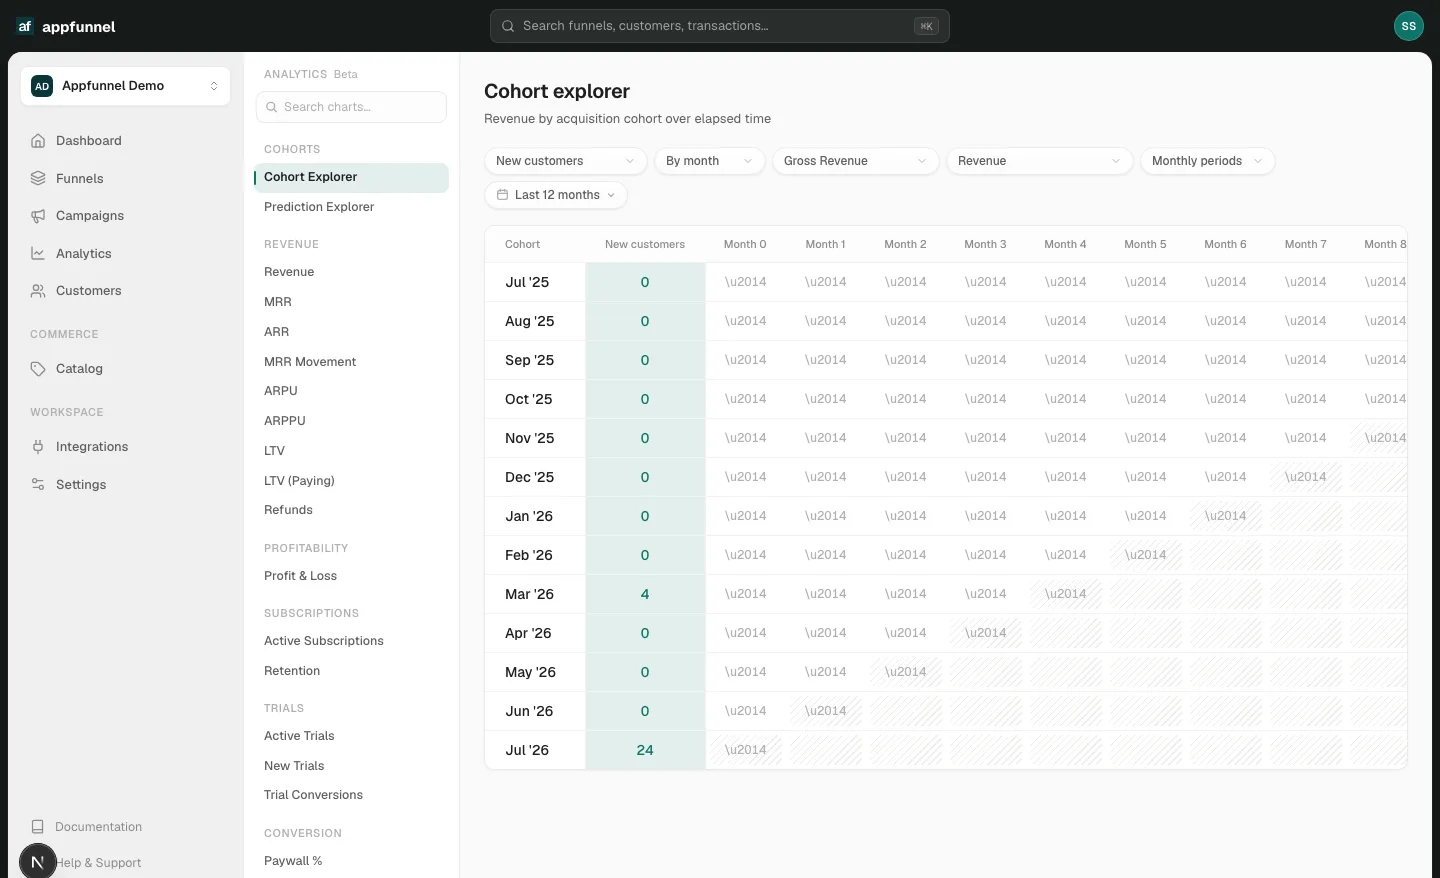
Averages hide the story that acquisition cohorts tell. The cohort revenue explorer lays out realized revenue and lifetime value by the period a customer joined, across every elapsed period since, so you can see how each cohort actually pays back over time.
Use cases
- Read payback curves - watch a cohort accumulate revenue period by period until it clears its cost
- Compare acquisition months - see whether a recent cohort is tracking ahead of or behind an older one
- Pick your basis - view the grid on gross, net, or any amount basis that matches the question
Impact
You stop judging cohorts before they have had time to earn. The grid shows exactly when each acquisition cohort turns profitable and how they diverge, which makes spend decisions far less of a gamble. It is the difference between a blended average and knowing which month of customers actually paid off.